Is Crypto Going to Recover? November 2026 Data + Meme Coin Outlook
Is crypto going to recover? Bitcoin is 40.6% off its high after five red weeks, yet pump.fun just had its best month since May 2025. The data, and the move.

Ready to create your Solana token? Enter your token details, choose your authority options, and confirm in your wallet.
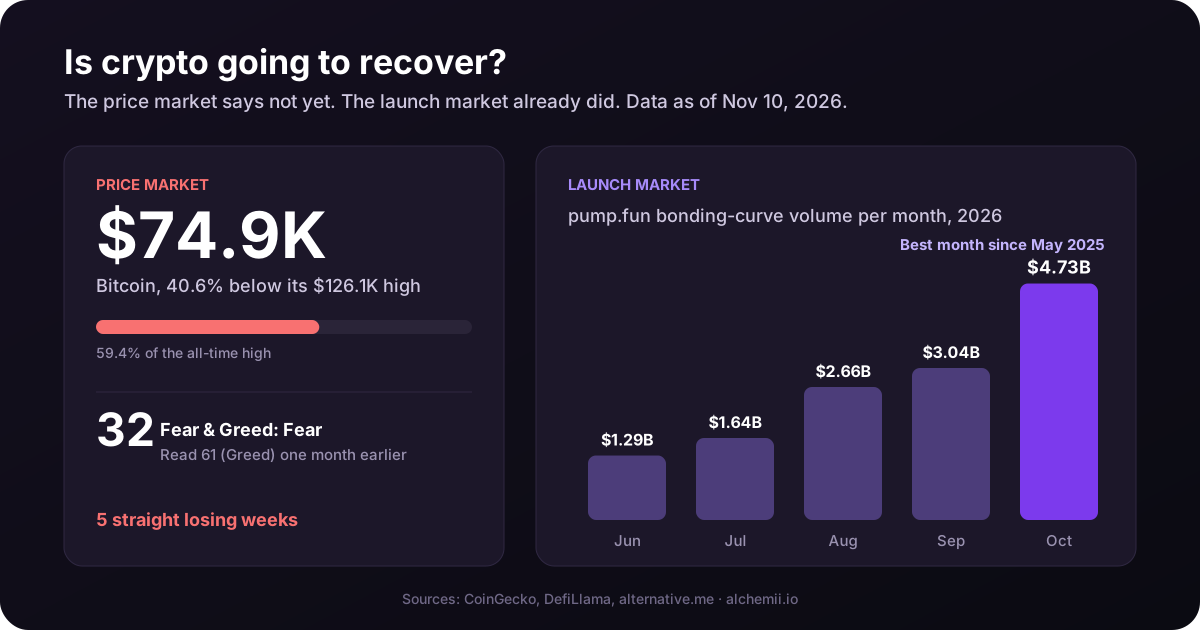
Is crypto going to recover? The honest answer on November 10, 2026 is that the price market has not, and the signals that usually come before a recovery are still red. But the part of crypto that matters most to a meme coin creator already had its best month in 17 months. Bitcoin closed a fifth straight losing week and sits near $74,900. Total market value is about 41% below its October 2025 peak. Yet traders put $4.73 billion into pump.fun bonding curves in October, 3.7 times what they spent in June. This update walks through the numbers, explains why crypto is down this week, lists the six signals that would mark a real turnaround, and shows what a creator can do today instead of waiting for one.
The crypto market on November 10, 2026
Five of these six readings are bad. Bitcoin fell to about $73,500 on Sunday, November 8, its lowest level since August, FXStreet reported. The Fear & Greed Index touched 25 (Extreme Fear) on November 7 and has been in Fear all week, down from 61 (Greed) a month earlier.
The quieter warning is stablecoins. Total supply fell from $307.9B on October 7 to $292.0B today, per DefiLlama. Stablecoins are the dollars waiting on-chain to buy something. When that pile shrinks by $15.9 billion in a month, money is leaving crypto, not just changing seats inside it.
The bigger coins have fallen further than Bitcoin. Ethereum is $2,128, 57.0% below its August 2025 high. Solana is $86.45, 70.5% below its January 2025 high and down 21% in 30 days. Bitcoin's share of the whole market is 59.6%, a sign that whatever money is left is hiding in the largest asset. That is typical of a market that is still scared.
Why is crypto down right now?
If you are asking "why is all crypto going down at once," it is because six separate problems landed inside two weeks. Each one alone would be a normal bad week. Together they explain a fifth losing week in a row.
| Driver | What happened | When |
|---|---|---|
| Exchange hack | About $6.36B moved out of Binance wallets on ten chains, per TRM Labs; the largest crypto theft on record | Oct 29 |
| ETF outflows | US spot Bitcoin ETFs lost $1.28B in a week, the worst since June; IBIT was about 95% of it | Nov 2–6 |
| Tech-stock sell-off | AI and chip stocks pulled the Nasdaq down 5.5%; BTC fell from ~$80.9K to ~$75.6K | Nov 5 |
| Rate-hike repricing | 165K October payrolls vs. 59K expected; Kalshi put a December hike at 79% | Nov 6 |
| Faded election bounce | BTC hit ~$81K after the midterms, then reversed on fears of tougher crypto rules | Nov 4–8 |
| Leverage flush | About $1.1B of leveraged positions liquidated in 24 hours | Nov 8–9 |
The Binance theft set the mood. On October 29, an attacker moved about $6.36 billion out of Binance wallets on ten blockchains, most of it in about 20 minutes, according to blockchain analysts TRM Labs and Chainalysis, as reported by Al Jazeera. Binance paused withdrawals and said it would cover all losses, partly from company funds, since the theft is more than six times its $1 billion user-protection fund. But the largest exchange in the world losing that much money in one evening shakes confidence, even among people who never used Binance.
Then the big buyers stepped back. US spot Bitcoin ETFs lost $1.28 billion from November 2 to 6, their worst week since June, with BlackRock's IBIT accounting for about 95% of it, per FinScans. Those funds were the steady demand behind most of 2026's rallies.
Then stocks and rates turned. Bitcoin has been trading like a tech stock. When AI and chip stocks sold off on November 5, the Nasdaq fell 5.5% and Bitcoin slid from about $80,900 to $75,600 in a single day, per CryptoTicker. A day later, a stronger-than-expected October jobs report pushed traders toward a December interest-rate hike. Kalshi traders put the odds of a December 9 hike at 79%, KuCoin News reported. Higher rates make cash more attractive and risky assets less so.
The election bounce faded. Bitcoin climbed to about $81,000 on November 4 after the US midterms, then reversed as traders worried about tougher crypto rules from a Democratic Congress. FXStreet's breakdown lists regulation, ETF outflows, inflation data and the tech sell-off as the four main drivers.
Leverage made it worse. About $1.1 billion of leveraged positions were force-closed in 24 hours over the November 8–9 weekend, per FXStreet. Every forced sale pushes the price down a little more, which triggers the next one. That is why crypto drops feel faster and deeper than the news alone explains.
Two dates matter this week: US inflation (CPI) data for October on November 10, and an MSCI decision on November 11 naming which firms with large crypto holdings, such as Strategy and Metaplanet, drop out of its indexes. Either can move the market a few percent in a day.
Is crypto going to recover? Look at 2026 so far
The most useful history is this year's. Crypto already recovered twice in 2026, and both times the bounce came when the mood was about as bad as it is now.
On weekly prices, Bitcoin fell 31.6% from mid-January to late February, then recovered 24.7% by early May. It fell 27.6% to $59,089 by July 1, then recovered 46.7% to $86,693 by late September. Since then it is down 13.6%.
Read the chart two ways:
- The hopeful version: the current drop is smaller than the two before it, and the price is still well above July's low. In a market that has bounced twice, a third bounce is not a wild idea.
- The cautious version: neither recovery got back to January's $95,600, let alone the $126,100 peak. For ten months Bitcoin has moved inside a range of roughly $59,000 to $96,000. A bounce inside that range is not the same thing as the market recovering.
So, is crypto ever going to recover to its all-time high? Bitcoin has done it after every bear market so far, but those recoveries took years, and past cycles are not a promise. From today Bitcoin needs about +68% to get back to its high. Solana needs about +239%. Four of the seven biggest meme coins in the chart below need more than +1,000%. Anyone giving you an exact date is guessing.
What's happening to meme coins?
The meme coin market is two different markets right now, and they are moving in opposite directions.
The old leaders are not coming back
CoinGecko's meme category is worth $26.2 billion, down about 20% from $32.8 billion on August 22. The Solana meme category is $2.47 billion, down from $3.50 billion over the same period. Here is how far the biggest names sit below their all-time highs:
Holding last cycle's winners has been a painful trade. TRUMP is down 40% in the last month alone. PUMP, the pump.fun token, is down 34%. PEPE is the one exception, up 33% in 30 days, which is a reminder that individual coins can run even when the market is red.
New launches just had their best month since May 2025
Now look at where trading actually happened. pump.fun's bonding curve is the launch stage, where a new coin trades before it "graduates" to a regular pool (how a bonding curve works). Traders spent more on that stage every month from June to October:
October's $4.73 billion is the highest month since May 2025, and pump.fun's own revenue hit $44 million, also its best since May 2025. That happened while Bitcoin fell from about $84,000 to $81,000 over the month. Fear in the price market did not stop people from trading new coins. It may have pushed some of them there, because a new coin can move 10x in an hour while Bitcoin moves 3% in a week.
The detail that matters most for creators is what happened after launch:
| Month (2026) | Bonding-curve volume | PumpSwap volume | pump.fun revenue | Solana DEX volume |
|---|---|---|---|---|
| June | $1.29B | $15.19B | $18M | $69.3B |
| July | $1.64B | $17.96B | $22M | $56.8B |
| August | $2.66B | $19.99B | $37M | $66.4B |
| September | $3.04B | $14.57B | $33M | $79.2B |
| October | $4.73B | $9.10B | $44M | $61.0B |
| Nov 1–8 daily pace | $109M/day | — | $1.0M/day | — |
Trading in coins that had already graduated, on PumpSwap, fell 54% from August to October. Total Solana DEX volume fell 23% in October. So the money did not spread across the whole meme market. It piled into the first minutes and hours of new coins, then thinned out quickly. Attention is concentrated at launch, and it does not stay long.
Be honest about November too: the first eight days ran about $109 million a day on the curve, roughly 29% below October's pace, as the price slide hit. The launch market cools when the whole market panics. It just did not cool first.
What this means if you want to create a meme coin
A Bitcoin recovery is a question about months and years. A new meme coin's fate is usually settled in its first day. Those are different clocks, and October showed they can run in different directions.
Three practical points follow from the data:
- You don't need to wait for the market to recover. Traders were spending more on launch-stage coins in October than at any point in 17 months, during a falling market. The audience for new coins is there now.
- Plan for the first hours, not the first month. Post-launch trading halved while launch trading rose. Have your X post, Telegram, image and liquidity ready before you sign, because the window is short. Our meme coin launch checklist covers the order.
- Start from what is already moving. In a nervous market, traders trust formats they recognize. The Trending Coins page shows what is live on pump.fun right now. Click Copy Coin on any of them and the homepage creator opens with the coin's setup filled in: name, ticker, description, image and meme coin defaults. Change it into your own idea, then launch.
Copy a coin that's already running. Mint an address that ends in pump.
- One-click Copy Coin —
- hit Copy Coin on the live Pump.fun board and this form reopens with that coin's name, image and memecoin settings already filled in. No extension to install, and the launch ends in a pool you own.
- The pump address, without the bonding curve —
- tick Pumpfun Token and your mint ends in pump on a launch you own outright, with nothing skimmed off every trade afterwards. How it works.
Does creating a coin pay? Sometimes, and more often than trading, in our measured sample. When we followed 921 new pump.fun coins launched on October 1, 2026, 45.4% of creators ended up in profit after 46 hours, against 20.5% of trader wallets. Those are pump.fun results for one cohort, not a forecast for any coin, and most creators still lost money. The full study is here.
How to create a Solana meme coin in about 5 minutes
- Connect a Solana wallet such as Phantom or Solflare on the Alchemii homepage.
- Fill in the name, ticker, image and description, or start from a trending coin with Copy Coin.
- Keep the meme coin defaults (1 billion supply, 6 decimals) unless you have a reason to change them.
- Revoke mint authority in the same transaction, so nobody can print more supply later. Traders check this first.
- Sign once. A standard launch costs about 0.22 SOL all-in (0.2 SOL service fee plus Solana's network costs), or about 0.32 SOL with mint authority revoked. At today's SOL price of $86.45, that is roughly $19 to $28.
- Open a liquidity pool so people can trade it. This is a separate step and needs its own SOL. If you want the mint address to end in
pump, the pump suffix option adds 0.1 SOL.
The full walk-through, with screenshots, is in how to create a meme coin on Solana. For a full cost breakdown, see how much it costs to create a Solana token.
Six signals that would mean crypto is recovering
Don't wait for a headline that says "the bear market is over." It will arrive after the move. Watch these instead:
| Signal | Reading on Nov 10 | What a recovery looks like |
|---|---|---|
| Bitcoin vs. 2026 range | $74.9K, inside $59K–$96K | A weekly close above ~$87K, the September high |
| Spot ETF flows | −$1.28B in the week to Nov 6 | Several straight weeks of net inflows |
| Stablecoin supply | $292.0B, down $15.9B in a month | Supply growing again: fresh dollars arriving |
| Fear & Greed | 32 (Fear) | Holding above 50 without spiking straight to 80 |
| Fed path | December hike being priced | Hike odds fading after CPI and the December meeting |
| Meme launch activity | $4.73B in October, cooling in November | Daily curve volume back above $150M |
One green signal is noise. Bitcoin can jump 10% in a day on a short squeeze, as it did in August, and give it back within weeks. When four or five of these turn at once, the recovery is real. We covered the last false start in Is the crypto bull market back? and the drawdown before it in crypto bear market 2026. For Solana specifically, see the September SOL market update.
Frequently Asked Questions
Is crypto going to recover?
Nobody can promise it will, but it has already recovered twice in 2026. Bitcoin rose 24.7% from late February to early May and 46.7% from July 1 to September 23, measured on weekly samples. Neither bounce reclaimed January's $95.6K. On November 10, 2026 Bitcoin traded near $74.9K, 40.6% below its $126.1K high, after five straight losing weeks. A durable recovery would show up as a weekly close above the September high near $87K, weeks of ETF inflows and stablecoin supply growing again.
Why is the crypto market down right now?
Six things hit inside two weeks: about $6.3B was stolen from Binance on October 29, US spot Bitcoin ETFs lost $1.28B in the week to November 6, an AI and chip-stock sell-off dragged the Nasdaq down 5.5% on November 5, a strong October jobs report pushed traders toward a December rate hike, the post-midterm bounce to about $81K faded on regulatory worries, and about $1.1B of positions were liquidated over the November 8–9 weekend. Stablecoin supply also fell $15.9B in a month.
Is crypto ever going to recover to its all-time high?
Bitcoin did it after every previous bear market, but the timing varied by years, not weeks, and past cycles are not a guarantee. Today Bitcoin needs about a 68% rise to get back to $126.1K, Solana about 239% to reach $293, and TRUMP, WIF, FARTCOIN and BONK each more than 1,000%. Treat any date-specific all-time-high prediction as a guess.
Are meme coins dead in 2026?
The old leaders are badly hurt: TRUMP is 98.5% below its high, WIF 96.7%, BONK 95.1% and the meme category's market cap fell about 20% between August 22 and November 10. But launch activity is not dead. pump.fun bonding-curve volume hit $4.73B in October 2026, 3.7 times June and its best month since May 2025, while the Bitcoin price was falling.
Should I create a meme coin while crypto is down?
A down market changes your odds less than people think, because new meme coins live or die in their first hours, not over a market cycle. October showed traders were still spending heavily on launch-stage coins even as Bitcoin fell. Create one if you have a clear meme, a first-day distribution plan and a budget you can afford to lose. On Alchemii a standard Solana token costs about 0.22 SOL all-in and takes a few minutes.
What should I watch to know if crypto is recovering?
Watch six signals together: a Bitcoin weekly close above about $87K, several weeks of spot ETF net inflows, stablecoin supply growing again, Fear & Greed holding above 50, December rate-hike odds fading, and pump.fun daily bonding-curve volume back above $150M. One green signal is noise. Four or five at once is a recovery.
Sources
- Global market data and coin categories — CoinGecko API (accessed 2026-11-10)
- Bitcoin price history and all-time high — CoinGecko (accessed 2026-11-10)
- pump.fun volume, fees and revenue — DefiLlama (accessed 2026-11-10)
- PumpSwap volume — DefiLlama (accessed 2026-11-10)
- Solana DEX volume — DefiLlama (accessed 2026-11-10)
- Total stablecoin market cap — DefiLlama (accessed 2026-11-10)
- Crypto Fear & Greed Index — alternative.me (accessed 2026-11-10)
- Binance says $6.3bn stolen in biggest crypto heist in history: What we know — Al JazeeraOctober 30, 2026
- Bitcoin ETFs shed $1.28B in weekly outflows as price slips to $74,049 — FinScansNovember 9, 2026
- Why is Bitcoin falling? Four key drivers and what to watch this week — FXStreetNovember 9, 2026
- Crypto market drops 3% amid strong US jobs report and Fed rate hike speculation — KuCoin NewsNovember 2026
- Crypto news this week: recap, prices and key dates — CryptoTickerNovember 2026
Market data is a snapshot from November 10, 2026, around 06:00 UTC. Prices move constantly, so re-check live figures before acting. Nothing here is financial advice.
The price market may take months to decide whether it is recovering. New-coin traders already decided in October. If your meme is ready, create your token on the Alchemii homepage now →, or start from a coin that is trending today →.
Create your Solana token
Choose your token name, symbol, supply and image. Review the authority options and creation fee, then confirm the transaction in your wallet. Liquidity is a separate step.
Related Topics
More guides to Solana token creation, authorities, liquidity, and meme coin launches.
Is the Crypto Bull Market Back? Meme Coin Launch Guide (2026)
Bitcoin just logged its biggest week in two years as meme volume returned. Read the data, then launch a Solana meme coin without waiting for migration.
What Is a Bonding Curve? Pump.fun Formula & Calculator (2026)
A bonding curve prices a token by formula. We read pump.fun's live curve on-chain: 30 SOL virtual reserve, 85 SOL to graduate. Try the calculator.
How to Make Money on Pump.fun: Creator Rewards
How to make money on Pump.fun: creator fee rates, Holder Rewards and a payout calculator. Read the full guide and plan your launch.
Meme Coin Market Cap 2026: $36B by Coin & Chain
The meme coin market cap is $36.45B, 76% below its record, yet launchpad fees just hit $10.3M a day. See the data by coin and chain, then launch your own.
Why Is Solana Going Up? SOL Market Update (Sept 2026)
Why is Solana going up? SOL hit $122 on 250ms blocks, ETF inflows, record stablecoins and meme coin fees. The data, the price levels, and how to launch now.
Pump.fun Callouts Explained: How to Use Them & Check Rewards
What Pump's Callout Rewards terms really say: the Activity Metric is confidential, rewards are discretionary, and only the on-chain transfer counts as payment.